Why Humanists Should Fall in Love with “Big Data,” and How?
Maps show historical continuity. Here is a map of high speed railways in China as of 2011 (red lines) displayed on top of Ming dynasty courier stops (blue dots). Certainly there are interesting differences, but the overlap between the two transportation networks separated by several centuries is all the more striking.
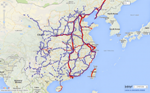
Map 1. High speed railways in China as of 2011 (red lines) and Ming courier stations (blue dots). Credit: China’s History in Maps @WorldMap.
Maps show historical change. Look at the following set of maps, showing from where prefectural governors in the 1040s (map 2a) and the 1210s (map 2b) hailed. Different spatial patterns stand out immediately. Prefects of the 1040s came predominantly from the Song capital region (Kaifeng and Luoyang), while the vast majority of those in the 1210s hailed from a stretch of prefectures located along the southeast coast. To me, this contrast suggests very different logics of political success in the two periods. In the 1040s, as in the late Tang, the capital monopolized cultural and political resources essential for climbing the ladder of success. In the 1210s, by contrast, economic prosperity seems to be what was at work.
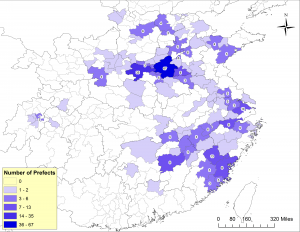
Map 2a. From where did prefects of the 1040s hail? Data from the China Biographical Database (CBDB) and additional research, mapped in ArcGIS.
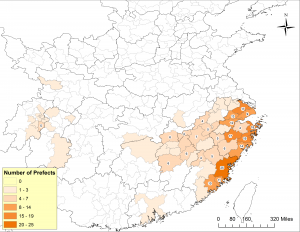
Map 2b. From where did prefects of the 1210s hail? Data from the CBDB, mapped in ArcGIS. (For full analysis of maps 2a and 2b, see Song Chen, “Governing a Multicentered Empire: Prefects and Their Networks in the 1040s and 1210s,” in State Power in China, 900-1325, edited by Patricia Buckley Ebrey and Paul Jakov Smith. Seattle, WA: University of Washington Press, forthcoming.)
Both maps encourage us to look at the forest (macroscopic patterns), not the trees (individual persons or places). But the forest is interesting. With a view of the forest, we may look at the trees from new perspectives. The map of transportation routes, for example, highlights the importance of Zhengzhou, Wuhan, and Changsha as major hubs of transit in both periods. It also reveals new patterns of land transportation in the Sichuan basin in the 21st century, which makes us wonder, for example, what the implications are for those stops on today’s high-speed railway lines but not on the major Ming courier routes (e.g., Suining).
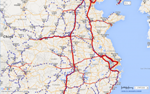
Map 3a. Close-up on central China in Map 1a. “High speed railways in China as of 2011 (red lines) and Ming courier stations (blue dots).”
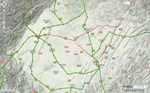
Map 3b. Close-up on Sichuan basin in Map 1a. “High speed railways in China as of 2011 (red lines) and Ming courier stations (blue dots),” showing also Ming courier routes (green lines).
The same thing can be said of the maps on Song dynasty prefects. In the 1040s no Wenzhou men held prefectural governorships; in the 1210s, fourteenth of them did. Extraordinary progress, was it not? But why? One may find answers in the auspicious landscape of Wenzhou or the virtues of literati families that lived there during the Southern Song era. That could make an amazing story, a story many of us know so well from reading local gazetteers and genealogies. But what the maps show is that the success of Wenzhou was not as unique as it appears. It was not so much a matter of local exceptionalism as something that needs to be understood with wider spatial and temporal horizons.
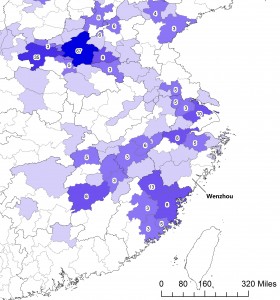
Map 4a. Close-up on the Southeast Coast in Map 2a. “From where did prefects of the 1040s hail?”
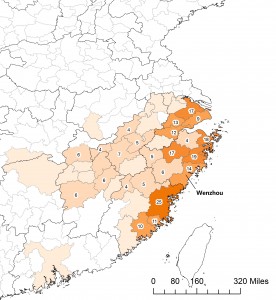
Map 4b. Close-up on the Southeast Coast in Map 2b. “From where did prefects of the 1210s hail?”
Wider horizons. Patterns. These are what these maps are good for. These are what makes “big data” fascinating overall. It draws our attention to change and continuity in historical structures. We sacrifice nitty-gritty details for understanding macroscopic patterns; we then take a new look at individual persons, places, and events in the light of these patterns.
The “Big Data”
Speaking of world literature, Franco Moretti (“Conjectures on World Literature,” New Left Review 1 (2000): 55) says perceptively that it is “not an object, it’s a problem, and a problem that asks for a new critical method” other than “just reading more texts.” The same can be said about “big data.” In recent years, large bodies of literary, historical, and religious texts have been digitized and made available as full-text searchable databases. The digital Siku quanshu (四庫全書) project, for example, has 3,460 titles, totaling approximately 800 million characters. The Scripta Sinica (新漢籍全文資料庫) and Guoxue baodian (國學寶典), too, contain several hundred million characters each, and both are still expanding. The commercial publisher Erudition (愛如生) has also developed several large-scale full-text databases on genealogies, inscriptions, and other specialized texts.
But “big data” should not be defined only by volume. It should be defined by the problem the volume creates. Judging by volume, the “big data” we humanities scholars have today comes nowhere near what many natural and social scientists are dealing with. About 200 billion tweets, say, are tweeted per year on Twitter. The U.S. National Security Agency (NSA) collects millions of text message daily as of 2011 and is finding ways to graph and analyze data on at the petabyte scale (one petabyte = one million gigabytes).
The “big data” becomes “big” because it offers new research opportunities, but to take advantage of these opportunities poses methodological challenges. The opportunities and the challenges go hand in hand. The threshold for being “big” is specific to each discipline, but in all disciplines, the scenarios are quite similar. Advances in computational technologies have expanded the scale of available data – structured or unstructured, qualitative or quantitative – so dramatically that they allow us to ask new questions. But to answer these questions, the traditional methods of analysis in the discipline are no longer adequate. Lev Manovich (Manovich, et al, “How to Compare One Million Images?” in Understanding Digital Humanities. Edited by David M. Berry. New York: Palgrave, 2011) speaks eloquently of this challenge. When digital images of one million manga pages are just a few clicks away from our fingertips, how are we going to study them? Our life is short, and we are not blessed with the eyes of Argus Panoptes or the memory of Mnemosyne. Even if we take pleasure in reading all the manga pages, we have difficulty registering the subtle differences between them. The unprecedented volumes of data call for unprecedented solutions. The solutions, again, lie in the world of computational methods.
“Bag of Words”
The solutions fall into two broad categories. Compare the two images below.
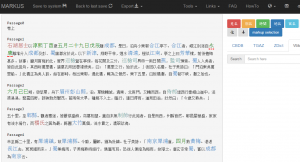
Figure 1. Automated Markups on Wu chuan lu using MARKUS, showing only the first five passages. The text of Wu chuan lu is retrieved from Donald Sturgeon’s Chinese Text Project site.
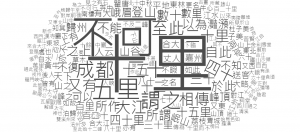
Figure 2. Word Cloud of Wu chuan lu using Guan-tin Chien’s HTML5 Word Cloud Generator. Words with a frequency of four or less are excluded for clarity.
These two images are visualizations of the same text (Wu chuan lu 吳船錄 by Fan Chengda 范成大 1126-1193). To create these images is, in fact, fairly easy. Once you have a digital copy of Wu chuan lu (I obtained the one used above from the Chinese Text Project), all you need is a modern web browser, an internet connection, a few clicks, plus a few seconds’ patience. The first comes from MARKUS, and the second from a word cloud generator. The difference between these images is significant. Both take the view that some words are more important than others. They either highlight these more important words with different colors or present them in larger type size.
But, MARKUS and the word cloud use completely different criteria for judging how important a word is. Word clouds conduct a simple count, calculating how many times each word appears in the text. So, the term 十里 (shi li) is giant in the word cloud because it is the most frequent phrase in our text with a total of 67 occurrences (including those cases where it is part of phrases like 二十里 (er shi li), 三十里 (san shi li), etc. MARKUS, by contrast, applies an entity-relationship model to a text and uses computational algorithms to “mine” them. An entity could be anything, specific or abstract. It could be a date, a place, an official title, a personal name, a book, an organization, or something else entirely. MARKUS favors those words which signify an entity and ignores those which do not. That is to say, MARKUS sees a text as a repository of data – though the data are presented in narrative form – on named entities and their relationships (e.g., who held which office when and where).
MARKUS and the word cloud take utterly different positions on word order in a text. MARKUS focuses on word order, at least to the extent that it provides clues on how entities may be identified and how they relate to each other (e.g., saying “X recommends Y” is different from saying “Y recommends X”). For word clouds, however, word order is totally irrelevant. Its approach is also referred to, quite aptly, as the “bag-of-words” approach, which completely ignores syntax and treats each text as a collection of words. The word cloud is the simplest implementation of this approach. All it does is to break a text into words, count the number of occurrences of each word, and scale them accordingly. As useful as it might be as an exploratory tool (the word cloud of Wu chuan lu, for example, tells us at least that the book has rich information on mountains and rivers in Sichuan and geographic distances), the word cloud nevertheless works under problematic assumptions. It assumes a straightforward relationship between word and meaning. It assumes that each word has only one meaning, which can be understood independently from the context and that top frequency words reveal main thematic and/or stylistic features of the text.
Not all programs taking the “bag of words” approach make these assumptions. “Topic modeling,” for example, uses a probabilistic model to infer subject matter from word collocations. Although it also disregards word order, topic modeling recognizes that the same word may have different meanings in different contexts and it tries to “know a word by the company it keeps” (that is, to infer the meaning of a word from its context). Since a word in East Asian texts may consist of two or more characters and is not separated from other words by white spaces, very often, scholars who follow the bag-of-words approach have to either take each character as a distinct unit of meaning (say, 陛 (bi) and 下 (xia)) are to be treated as two words even if they stand side by side in the text) or find ways (e.g., the N-gram approach or more sophisticated models developed by Stanford and Academia Sinica) to group characters into more meaningful units of analysis. Despite these challenges, this approach has yielded exciting results in identifying discursive and stylistic features of large textual corpora. In his work on stylometry, for example, Paul Vierthaler (Digital Approaches to Late Imperial Chinese Literature research talk delivered at the Fairbank Center for Chinese Studies, Harvard University, 2014 on Youtube: https://www.youtube.com/watch?v=adRlz2HbDD0) shows how even character-unit analysis helps us understand yeshi 野史 as a literary genre. In the works of Donald Sturgeon, this approach is combined with network analysis techniques to explore the complex relationships between texts in a large corpus based on their similarities (for similar works outside the China field, check out Matthew Jockers and Matt Erlin).
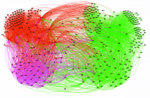
Figure 3. Network graph showing text reuse in the Korean Buddhist Canons by Donald Sturgeon. Buddhist canons are labeled by numbers according to Lewis R. Lancaster’s catalogue (http://www.acmuller.net/descriptive_catalogue/index.html) and divided into different clusters (shown in different colors) based on the degree of text reuse. Reproduced with permission of the author.
Generally speaking, the “bag-of-words” approach and the entity-relationship approach reflect very different assumptions about texts. The entity-relationship approach assumes a substratum of reality (or at least what the text claims as reality), known to us through the mediation of the text. It seeks to describe that “reality” by extracting from a text different entities and their relationships. The texts are a means to an end. To use the words of Zhuangzi, texts are “fishing stakes” employed to catch the “fish” (entities and their relationships); so, once we get the fish, we may forget the stakes. The “bag of words” approach, by contrast, tends to take the text itself as a meaningful subject of inquiry, seeking to understand its thematic and stylistic features. Sure, the line here is not always clear cut. Thematic differences in a text may themselves reflect not only authorial choices, but also different social realities. Ian Miller’s study of the Qing Veritable Records (“Rebellion, crime and violence in Qing China, 1722-1911: A topic modeling approach,” Poetics 41 (December 2013): 626-649), for example, uses topic modeling not only to show different discursive categories employed by the Qing bureaucracy but also to argue that these different discursive categories reflect different types of violence in the real world, each with its own temporal patterns.
The Entity-Relationship Model
Back to MARKUS. Remember, the “important words” in Wu chuan lu – those that are references to entities – have been “marked up” in MARKUS. Now what?
Some editorial corrections are in order (we’ll see a bit later how to minimize the amount of editorial work needed). But once we have done that, we can easily export the markups into a table by clicking a few buttons on the page. We can open the table in Microsoft Excel and filter, for example, to show only the personal names mentioned in the text. This gives us a list of men with whom Fan Chengda associated during his travels from Chengdu to Hangzhou in 1177 and those who, in Fan’s eyes, shaped the cultural landscape of Sichuan in the late 12th century. The IDs assigned here show possible matches in the China Biographical Database (CBDB), where we may find more biographical details on these individuals.
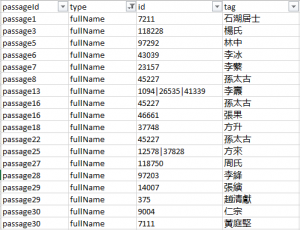
Figure 4. Automated markups of full personal names in Wu chuan lu, exported from MARKUS after editorial corrections.
Or we may look at only the places MARKUS has tagged, assign them appropriate geographic coordinates (for historical places in China there are a few sources, including CHGIS and Ruth Mostern’s Digital Gazetteer of the Song dynasty), and map out Fan Chengda’s travel route using CartoDB or other tools. This would give us an intuitive grasp of Fan’s travels in 1177. A good pedagogical tool, perhaps.
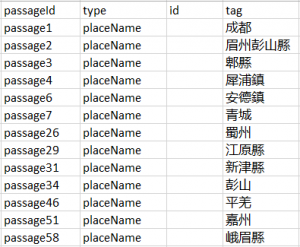
Figure 5. Automated markups of place names in Wu chuan lu, exported from MARKUS after editorial corrections.
But the real power of the entity-relationship approach reveals itself only when we apply it to large bodies of texts with a high precision rate (thus minimal editorial work) for macroscopic analysis. For instance, if we may mark up all references to travel routes scattered in twelfth-century records so as to reconstruct the transportation networks of the period. Endeavors like this often require more customized algorithms (hence, some knowledge of programming), a sizeable editorial team (because even a tiny percentage of errors in a large body of texts still means a heavy workload in absolute terms), and/or a willingness to accept a reasonable margin of error in the data (that is, to have confidence that a few dozen mistakes would not affect our conclusions drawn from several thousand data points).
The best example on this front is what the China Biographical Database (CBDB) team has been doing with biographical materials in Chinese history (and it is the CBDB that provides a large amount of the data for maps 2a and 2b above). Through collaboration between China experts and computer scientists, the team has been developing customized algorithms to systematically mark up all types of biographical data (bureaucratic appointments, kinship, and social relationships, etc.) in a large body of historical texts, and extracted and stored them in a relational database (Fig. 6). The organization of the database is based on the entity-relationship model as well. Dates, places, offices, persons, and books are all entities. Each aspect of a person’s life is represented as a type of relationship between entities. So, a bureaucratic appointment is an instance of a relationship involving a person, an office, a place (where he was posted), and a start and end date. Likewise, marriage is a relationship involving the husband and wife for a specific duration of time.
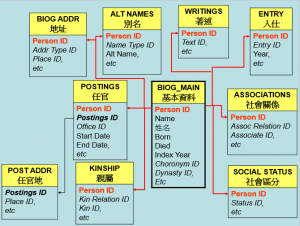
Figure 6. A highly simplified version of CBDB data structure
The database, therefore, facilitates research projects which study a large number of historical figures (CBDB will have biographical information on approximately 370,000 persons by its next release in May 2016), cross-examines different aspects of their lives, and integrates their biographical information, which has hitherto been scattered in various historical sources. For example, we may query the database on all the jinshi degree holders from the sixteenth century and then on kinship ties among them. The search will return hundreds of thousands of hits in a few minutes. And our hits are combining data collected from a wide range of sources, such as rosters of degree holders, local gazetteers, dynastic histories, and tomb epitaphs. A particular strength of CBDB also lies in its ability to make inferences about undocumented kinship relations from documented ones (e.g., reporting A as C’s grandfather if B is documented as A’s son and C’s father). We may then export the results in appropriate formats for large-scale statistical, spatial, and network analysis.
There’s Something for Everyone…
In short, the entity-relationship approach rests on one assumption and integrates the power of three digital domains. It assumes that texts are repositories of data on entities and their relationships. It uses data mining techniques to identify and extract these entities and their relationships (technically known as “named entity recognition” or simply NER). It organizes them into a relational database to facilitate integrated queries. The data, either directly extracted from the texts or queried from the database, may be visualized and analyzed for understanding macroscopic patterns.
Today, each of these three domains offer a wide range of choices which meet different user demands and accommodate different levels of computational expertise. Even a user with limited technical skills or experience may click into one of the maps shared on WorldMap, turn on and off layers, and explore spatial patterns on a topic of their choice, as we have done in map 1 above. Or they may try the automated markup function in MARKUS, or combine existing querying utilities in CBDB and “point-and-shoot” style visualization tools (such as CartoDB and Palladio) to answer simple research questions. With a few clicks in the desktop version of CBDB, one may find all known degree holders from 1000 to 1040; and then, with a little bit of twisting and a few more clicks in CartoDB, produce a map to show their spatial distribution.
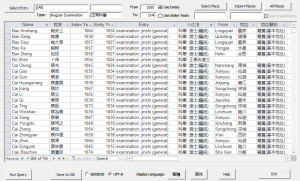
Figure 7. Query results of all degree holders from 1000 to 1040 using the querying utility available in the desktop version of CBDB
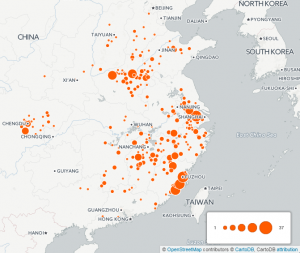
Figure 8. Map created in CartoDB showing from where the degree holders in the above query hailed
Likewise, one may use the built-in query utility in CBDB to find all scholarly connections involving people who flourished between 1030 and 1070, and then copy and paste the results into Palladio for a quick view of these connections and their geographical distributions.
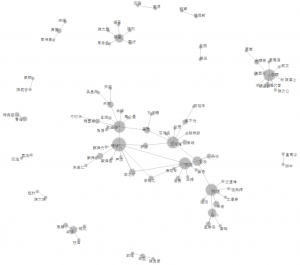
Figure 9. Network graph created in Palladio showing scholarly associations found in a CBDB query involving people who flourished between 1030 and 1070. The size of a node is in proportion to the number of other nodes with which it has connections.
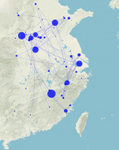
Figure 10. Map created in Palladio showing scholarly associations found in the above CBDB query involving people who flourished between 1030 and 1070. The size of a node is in proportion to the number of other nodes with which it has connections.
These quick visualizations reveal, in intuitive ways, major intellectual groups and their relationships with each other. That said, these “point-and-shoot” style tools have very limited analytical capabilities and give users very limited control over the style of representation.
Just a little bit more understanding of digital methods will allow us to make a big leap forward. Some knowledge of regular expression syntaxes (basically a computational rendition of formulaic expressions in natural language), for example, will significantly enhance our capability of tagging texts to address specific research needs. On top of automated markups, for example, we can submit simple regular expressions (regexes) in the “keyword markup” section of MARKUS to sift out unwanted place tags in seconds, significantly reducing the burden of editorial corrections.
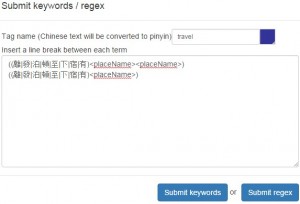
Figure 11. Regexes submitted in MARKUS to tag only places on Fan’s travel route in 1177.
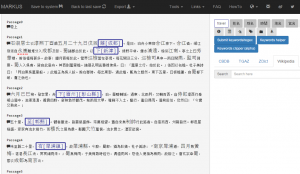
Figure 12. Keyword markup results on Wu chuan lu using the above regexes in MARKUS, showing only the first five passages.
Likewise, a bit more familiarity with relational databases and visualization tools will allow us to build customized queries in relational databases such as the CBDB, modify the query results based on additional research, and analyze them in more sophisticated programs like ArcGIS (for analyzing spatial patterns), UCINET, and Gephi (for analyzing and visualizing structural patterns in networks). Scholars have used these visualizations to study patterns of intellectual activity (see Peter Bol’s work on the daoxue movement: “GIS, Prosopography, and History” http://nrs.harvard.edu/urn-3:HUL.InstRepos:5363291) and political success, to name just a few examples, which research projects focusing on individual historical figures and events tend to obscure.
From here, more ambitious users may scale new heights by training themselves in one or more of the programming languages and writing customized data mining algorithms or developing public-facing, interactive projects. D3.js, R, and Python are among the most popular and tutorials are increasingly available for humanists (examples include D3.js in Action, Humanities Data in R, and the Programming Historian).
For teachers who want to introduce digital scholarship to students, this also means a wide range of courses we can add to the curriculum to address the needs of different students. Some students are eager to learn the digital methods and employ them in their research. Many others want simply to “understand” it. Though they no plans of becoming practitioners in the field, they are curious what digital scholarship means in the humanities disciplines and may even be puzzled as to over how to evaluate it. In the past few years, I have taught two courses at Bucknell and Harvard. One of them, entitled “Humanities Visualization,” was intended for the curious and values breadth over depth. The goal of the course was to introduce undergraduates to a wide range of visualization projects in the humanities and to develop a critical understanding of them in the context of contemporary debates on digital scholarship. Students get their hands dirty in class, but only with simple online tools which have very gentle learning curves. The point of doing so was not to make them good at using any of these tools, but to help them take the mystery out of digital humanities.
The other course, entitled “Chinese History in the Digital Age,” was quite different in orientation. Aimed primarily at future scholars in the East Asian studies fields, it was more project-based and had a stronger technical component, walking students through the entire process from marking up texts, designing databases, building customized queries, to developing visually informed arguments. One may easily imagine many similar courses along this line, such as courses focusing on a different set of technical skills (such as text analysis), organized around specific research topics and individual projects, or teach hardcore programming skills to address research needs in the humanities.
Courses like these are growing in numbers nationwide, in liberal arts colleges and research universities alike. I would never say that “big data” or “digital humanities” is the future of humanities. It may not become even a centerpiece of it. But I have no doubt it will be part of it. It’s time we welcome digital literacy as part of our humanities training.
Song Chen
Assistant Professor of Chinese History
Department of East Asian Studies
Bucknell University
songchen@post.harvard.edu
Links to projects and tools mentioned in this article:
China Biographical Database (CBDB) http://projects.iq.harvard.edu/cbdb/home
China Historical GIS http://www.fas.harvard.edu/~chgis/data/chgis/downloads/v4/
China’s History in Maps (Powered by WorldMap) https://worldmap.harvard.edu/maps/china-history
Chinese Text Project http://ctext.org/wiki.pl?if=en
The Digital Gazetter of the Song Dynasty http://songgis.ucmerced.edu/
HTML5 Word Cloud Generator http://timdream.org/wordcloud/
MARKUS http://dh.chinese-empires.eu/beta/index.html
Stanford Chinese Natural Language Processing (NLP) http://nlp.stanford.edu/projects/chinese-nlp.shtml#cws
Academia Sinica’s Chinese Word Segmentation System http://ckipsvr.iis.sinica.edu.tw/
Introductions to concepts mentioned in this article, friendly to humanities scholars:
Network analysis http://tedunderwood.com/2012/04/07/topic-modeling-made-just-simple-enough/
Regular expressions (regexes) http://projects.iq.harvard.edu/files/cbdb/files/text_extraction_regex_shihpei.ppt?m=1438182331
Topic modeling http://tedunderwood.com/2012/04/07/topic-modeling-made-just-simple-enough/